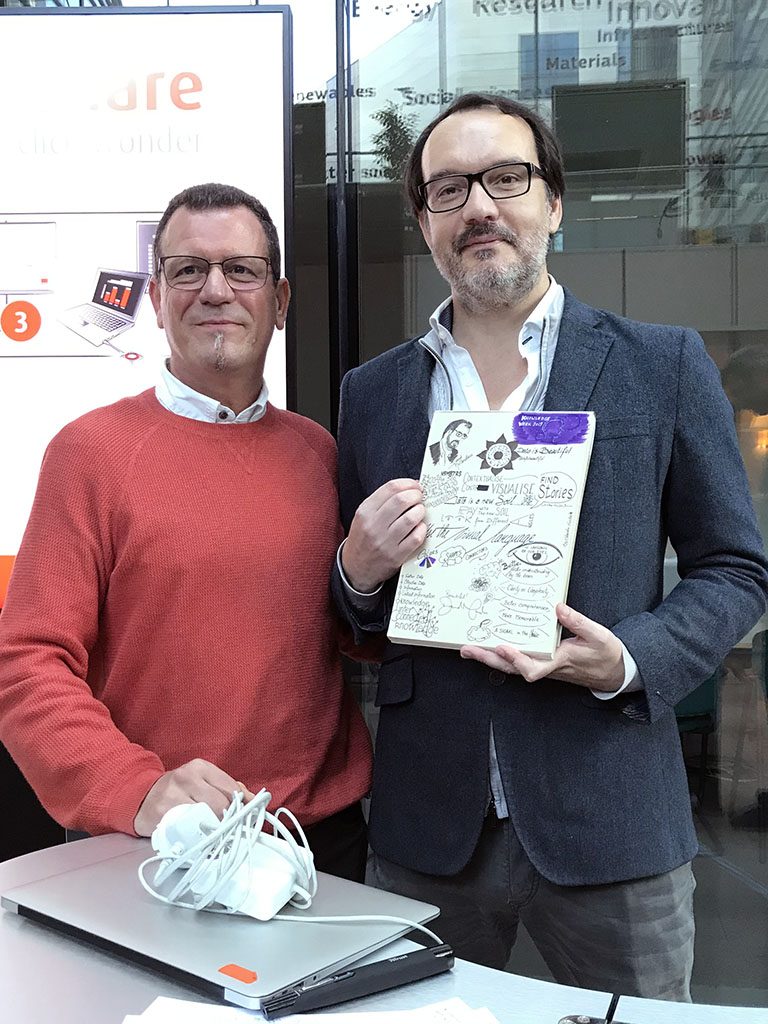
I had the privilege to meet David McCandless, data journalist and founder of Information is Beautiful, at the European Commission 2019 #EUknowledge week.
David gave the opening keynote speech “Making complex knowledge meaningful – the power of data visualisation”. This is my live sketchnotes of his presentation.
One of my colleagues summarised his speech as follow:
“We are engulfed in a sea of data. Using graphical images that everybody understands, helps to tell the story behind numbers. […] The story behind data doesn’t lie behind the numbers but in the message that the visualisation brings. […] Visualisation has the power of analysis, it turns data into a landscape that is ready for you to explore […] Data visualisation is like taking a photo, it brings into contrast what is in or out of focus, what is in the background, what is on the forefront. As a data journalist David feels close to photography journalism. You can zoom in or you can go wide to tell your story […] Visualisation unlocks what needs to be known, it gives clarity to big data. […] To be better understood you convert to a visual language. When you can encode the message in visualisation you bring clarity and there is beauty in clarity. “
I am so happy and honoured that David signed my sketchbook with “Beautiful”. It means a lot to me from the man who wrote “Information is beautiful” and “Knowledge is beautiful“.


