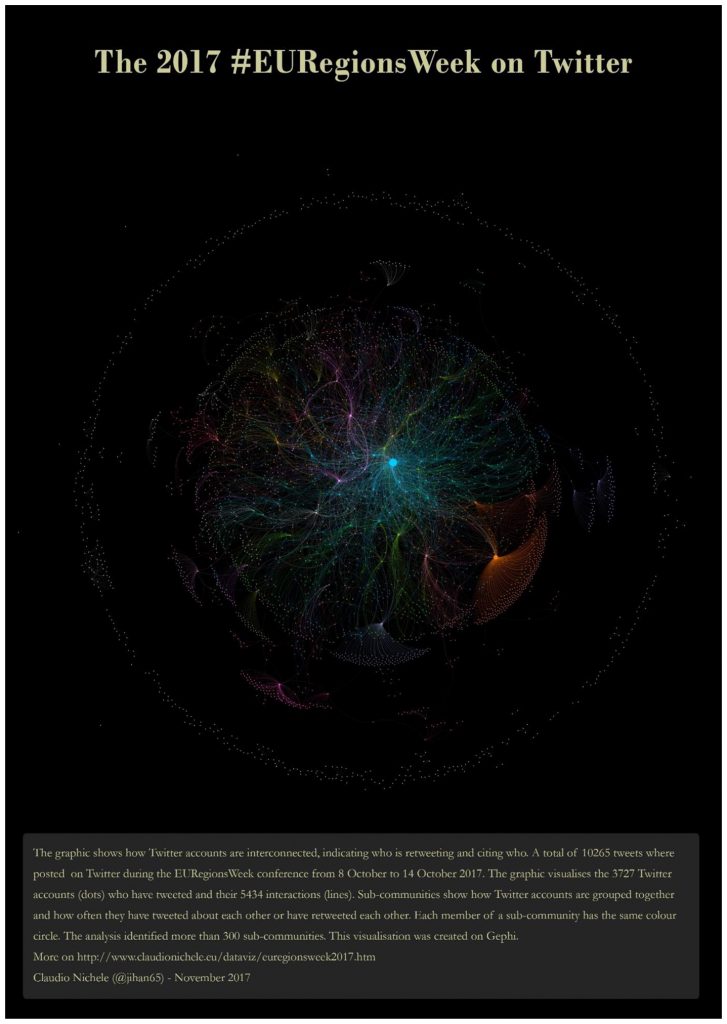
My original Visualisation of #EURegionsWeek 2017 on Twitter article is now published on the Regional Studies, Regional Science open access journal.
New RSRS Regional Graphic: @jihan65 visualization of the 2017 #EURegionsWeek on Twitter https://t.co/OfuX0wXSAT @regstud
— Regional Studies, Regional Science (RSRS) (@RSRS_OA) February 23, 2018
It gives me a sense of pride that @RSRS_OA asked me to publish my data visualisation in their journal. I’d like to thank them very much for giving me this opportunity.
As so often with me, I started this project as an experiment. Little by little I worked on the data and, after a lot of tests, I finally arrive at this beautiful visualization. I anticipated that there was more to say, then I continued my investigation to conclude the article with the influencers.
I acknowledge that being published on the Regional Studies, Regional Science journal is a nice recognition. Nevertheless, I still prefer my original article where I allow my visitors to interact with the graph and with data. And as a bonus, I also give them some background information about the methodology and the used tools.

